Lab2 - Classifying Iris species using k-nearest neighbor algorithm (10pts)
In this lab you will familiarize yourself with working with a dataset in Python Jupyter notebook.
At the end of the lab upload your notebook containing (1) all programming steps described in the textbook and (2) the answers to the questions below.
Grading:
(3pts) Correct markdown answers for the five questions in Part A.
(4pts) Correct run of the seven code sections in Part B, with sections labeled in markdown as required below.
(3pts) Correct markdown answers for the six questions in Part B.
Part A - Understand infromation about a UCI repository dataset
- In DataSpell create a new folder named
Lab2Iris. Right clickLab2Irisand select New > Jupyter Notebook to create a notebook named Lab2_Iris_Classification.
Make sure that you use markdown comments (a text-to-HTML conversion tool) to organize code sections in your notebook and for answering questions. For instance, to create a markdown text cell, type in a new cell #### Part A - Iris data, select Markdown from the top toolbar which by default is Code, and run the cell. The result is the plain text Part A - Iris data
- Now let’s read about the Iris data set which is published at the UCI Repository found here. This repository houses over 600 datasets, Iris data being one of them. Search for the Iris data and read the description of this data set, identifying answers for the following questions. Using markdowns, record answers to these questions in your notebok.:
- Q1: How many samples are in this data set?
- Q2: How many attrrbuites decribe this data? What is each attribute measuring?
- Q3: How many classes are there? What are the names of these classes?
- Q4: Are there many publications that have used this data set?
- Q5: In a simple editor, open and explore the file iris.data. How many rows and columns are in this dataset?
Part B - Use k-nearest neighbors to classifiy iris data
After you instal mglearn (see instructions below), follow the steps decribed in the MG textbook pg. 13-23 (section 1.7 in ch. 1; you may access it via our libary -> O’Reilly). Read through the pages and execute the Python commands in your notebook to learn how to explore and classify data. Also, pay attention to definition of terms like supervised learning, sample, feature, training data, testing data, generalization, k-nearest neigbor, prediction, model evaluation.
Organize the code given to you in the textbook in the following markdon sections:
Section1: Load data
Section2: Split data in training and testing
Section3: Look at data
Section4: Build k-nearest neighbor model
Section5: Make predictions
Section6: Evaluate the model
Section7: Summary
1) On a new cell, let’s install and import the custom package mglearn that comes with the book. Download mglearn from here and copy it in the root of your labs. For me the root is Users/svisa/DataSpellProjects/ because this folder contains my Lab1 and Lab2 folders.
Click on DataSpell’s Terminal icon located at the bottom of the left-most side bar, make sure you change the working directory to the folder you have placed mglearn into. (Use commands such as cd DataSpellProjects).
At command line run pip install mglearn.
In a new cell, type import mglearn and run the cell.
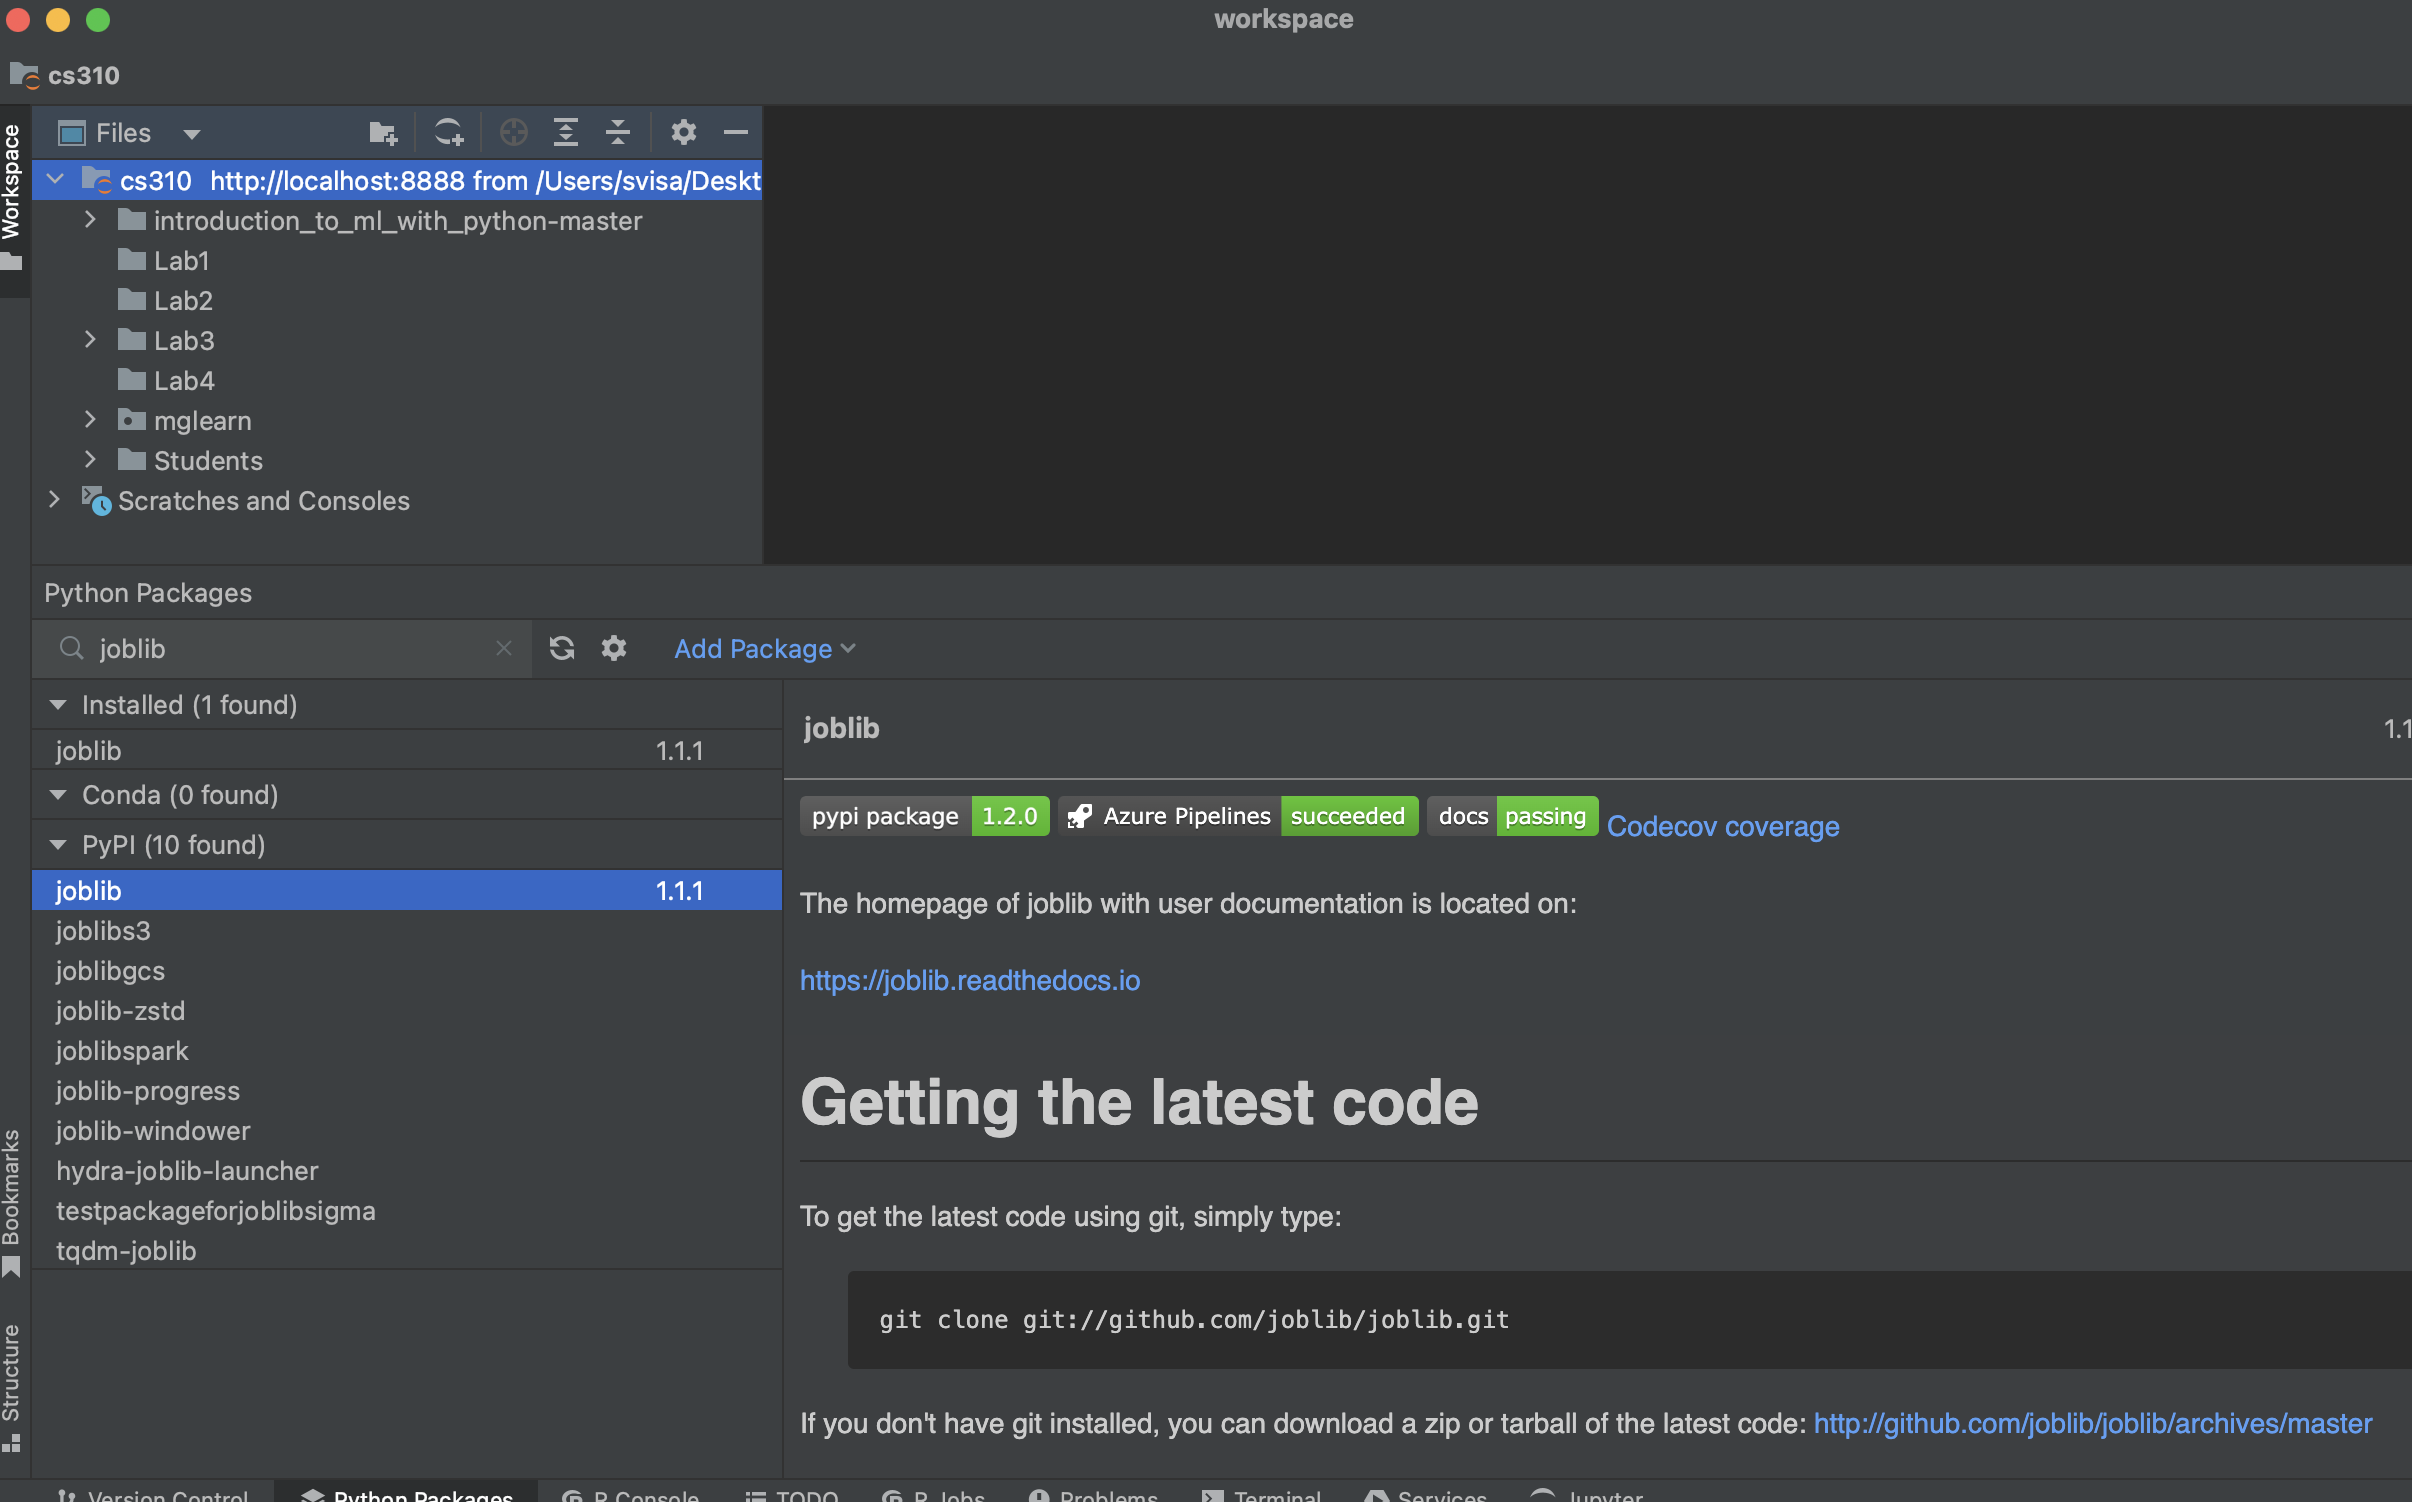
If you get an error like below, the fix is to uninstall joblib 1.2 and install joblib 1.1. You can do this in DataSpell in the Python Packages window illustrated below. The Python Packages button is located on the left-most side bar.
If the Python Packages window prompts you to 'Select an interpreter to see the installed packages', you may follow the steps explained at this JetBrains webpage to select a Python interpreter. In case the link does not work, here are copy-paste steps recommended by JetBrains: go to DataSpell>Settings>Project:worksapce>Python Interpreter. Click the Add Interpreter link next to the list of the available interpreters; select Add Local Interpreter; In the left-hand pane of the Add Python Interpreter dialog, select System Interpreter; then from the Interpreter drop-down select an existing onterpreter or click '…' and select a Python executable.
      5 from joblib import Memory
----> 7 memory = Memory(cachedir="cache")
2) In a new cell, let’s import the scikit-learn library and the dataset. The documentation for this library can be found here.
from sklearn.datasets import load_iris
iris_dataset = load_iris()
If you get an error about scikit-learn not being installed, click the Python Packages tab from the bottom of your window, search for scikit-learn package, then select the package under the Conda section and click Install with Conda button. If this installation fails, click the Terminal tab and run
conda install scikit-learn
or run inside a DataSpell cell
!conda install scikit-learn
If you get an error for “import mglearn” that reads as
ImportError:
load_boston has been removed from scikit-learn since version 1.2…..
Then you can fix it via two ways, pick only one from below:
Fix1)Uninstall scikit-learn 1.2 and install 1.1 version (you can do that from Python Packages window at the bottom of DataSpell)
Fix2)Go in mglearn folder, then open with Notepad the file datasets.py and comment out the following:
    from sklearn.datasets import load_boston

    …

    def load_extended_boston():
        boston = load_boston()
        X = boston.data
        X = MinMaxScaler().fit_transform(boston.data)
        X = PolynomialFeatures(degree=2, include_bias=False).fit_transform(X)
        return X, boston.target
Similarly, you might need to comment other references to the boston dataset; for instance, you might have to comment out inside the file plot_ridge.py the following:
    from .datasets import load_extended_boston

    …

    def plot_ridge_n_samples():
        X, y = load_extended_boston()
        plot_learning_curve(Ridge(alpha=1), X, y)
        plot_learning_curve(LinearRegression(), X, y)
        plt.legend(loc=(0, 1.05), ncol=2, fontsize=11)
3) Let’s also import pandas, a Python package for manipulating data - the package API can be found here.
import pandas as pd
4) Continue with all the Python commands in the textbook.
If you get an error similar to 'Err: Could not find mglearn.cm3…'
A possible fix is the following:
from matplotlib import cm

pd.plotting.scatter_matrix(iris_dataframe, c=y_train,
    figsize=(15, 15),marker='o', hist_kwds={'bins': 20},
    s=60,alpha=.8, cmap= cm.viridis)
At the end of your notebook create markdown text answers to the questions below.
Q1) What percentage of data is used for training and testing data, respectively?
Q2) Which class seems linearly separable from the other two based on petal length?
Q3) Explain what the k = 1 signifies in the k-nearest neighbor classification algorithm.
Q4) How many test points are used to calculate the 97% testing accuracy?
Q5) What command prints out the test data? What command prints out the true labels of the test data?
Q6) The following code outputs a result with 38 rows - inspect them. What can you say about the very last nonzero-number in this output? What does it tell you?
y_pred = knn.predict(X_test)

print("Test set predictions:\n", y_pred)

print("Test true labels:\n", y_test)

y_pred - y_test